Over our recent 5 month stay in Thailand we happened to acquire a jump rope. For most of the time it collected dust. Now that I’ve picked it up again I’m thinking the reason was because jumping rope is actually pretty challenging. On multiple levels.
There is the whole timing the rope turns in sync with your jumping, which stimulates brain activity and as crossrope.com explains:
…helps with the development of the left and right hemispheres of your brain, which further enhances spatial awareness, improves reading skills, increases memory and makes you more mentally alert.
As described in [an] article from BrainHQ, the best exercise for the brain involves a combination of timing, rhythm, coordination, and mental strategy.
When you’re jumping rope, you’re combining timing and rhythm while having to make quick calculations to ensure your brain is recognizing the rope’s distance, speed, direction, and position relative to your body to ensure the rotations keep going. This combination of physical and mental activity has a greater effect on cognitive function.
Other touted benefits include:
- high efficiency calorie burning
- improved cardio
- increased muscle engagement
- improved bone density
As the Jump Rope Institute says:
The benefits of this simple but yet complex training technique ranks as an ideal brain exercise, bone builder, and as one of the most efficient ways of improving cardiovascular fitness in as little as ten minutes.
More impressively, the Jump Rope Institute also says that with only 10 minutes of nonstop jumping at 120 jumps per minute (jpm) it can provide the same benefits as:
- 30 minutes of jogging (!)
- 2 sets of tennis singles
- 30 minutes of racket/handball playing
- 720 yards of swimming
- 18 holes of golf
What a missed opportunity for some quality fitness training (if true)!
The gear
After the first day of jumping, counting jumps wasn’t my favorite part. I started a spreadsheet recording the number of jumps and my max heart rate, and quickly realized that there is likely an even better way to track this data.
I headed over to the Garmin Connect IQ Store and was pleasantly surprised to find the really nice Jumps data field that not only counts your total jumps for you, but also gives you jumps over time data, jpm over time data, and a “Jumping Effect” score, which is supposed to be an indicator for how hard you trained with a value of 100 being equivalent to jumping 20 minutes non-stop at a 120+ jpm pace.
I also learned a new unit to describe efficiency of physical exertion: the metabolic equivalent or MET. A MET is defined as the objective measure of the ratio of the rate at which a person expends energy, relative to the mass of that person, while performing some specific physical activity compared to a reference, set by convention at 3.5 mL of oxygen per kilogram per minute, which is roughly equivalent to the energy expended when sitting quietly.1
So, you spend 1 MET sitting around playing video games, for example, and a whopping 12.3 METs jumping rope at a pace of 120-160 jpm!2 For additional reference, running at a 7 minute mile pace also costs about 12.3 METs.
The setup
Building off of the heat training running posts from this past summer and the utilities built, I realized it would be straightforward to create another automated data pipeline. The basic flow is:
- Pull raw data from GarminDb
bashscript to get Garmin .FIT files containing jump rope activity data from the cloud. - Run
fitparsePython script in R via thereticulatelibrary to convert binary .FIT to readable ASCII. - Post-process ASCII file using
readr::read_csvto get data into a dataframe, then formatting the data for plotting.
Step 1: Get raw data
library(DBI)
library(RSQLite)
library(tidyverse)

# Setup a working directory to copy files to for processing.
workDir <- "~/HealthData/FitFiles/working/"
# setwd(workDir)

con <- dbConnect(SQLite(), "/Users/amrit/HealthData/DBs/garmin_activities.db")

# dbListTables(con)

acts <- dbReadTable(con, 'activities')

# Path of the SQLite activities database.
path <- "/Users/amrit/HealthData/FitFiles/Activities/"

# Get .fit filenames based on running activity names.
cardio <-
  acts %>%
  filter(sub_sport == "cardio_training") %>%
  arrange(desc(start_time)) %>%
  # Allow partial activity date matching.
  filter(str_detect(start_time, "2020-")) %>%
  select(start_time, activity_id) %>%
  mutate(activity_id = paste0(path, activity_id, ".fit"))

save(cardio, file = "~/HealthData/FitFiles/working/cardio.Rdata")

# Copy .fit files to working directory.
walk(paste("cp", cardio$activity_id, workDir), system) # same as lapply w/ no output printed
Step 2: Convert data from binary to human readable form
getFitOut <- function() {

library(reticulate)
py_capture_output(py_run_string("import fitparse

# Load the FIT file
fitfile = fitparse.FitFile(r.fitFile)

# Iterate over all messages of type \"record\"
# (other types include \"device_info\", \"file_creator\", \"event\", etc)
for record in fitfile.get_messages(\"session\"):

    # Records can contain multiple pieces of data (ex: timestamp, latitude, longitude, etc)
    for data in record:

        # Print the name and value of the data (and the units if it has any)
        if data.units:
            print(\"{}, {}, {}\".format(data.name, data.value, data.units))
        else:
            print(\"{}, {}, NA\".format(data.name, data.value))
"))
}
Step 3: Format data for plotting
getJumpData <- function(jumpFit) {

# Run python file created by @mcandocia on GitHub @ https://github.com/mcandocia/examples/tree/master/convert_fit_to_csv
# to convert .fit data to .csv to allow for processing in R.

# source_python("jumps.py", envir = NULL)

jump <- read_csv(jumpFit, col_name = c('type', 'value', 'units'))

jump %>%
  filter(
    type == "unknown_110" |
    type == "Jumping Effect" |
    type == "Jumps" |
    type == "avg_heart_rate" |
    type == "max_heart_rate" |
    type == "avg_temperature" |
    type == "max_temperature" |
    type == "start_time" |
    type == "sub_sport" |
    type == "total_anaerobic_training_effect" |
    type == "total_training_effect" |
    type == "total_calories" |
    type == "total_elapsed_time"
    ) %>%
  select(type, value) %>%
  pivot_wider(names_from = type) %>%
  type_convert(col_types = cols(.default = col_double(),
                                start_time = col_datetime(),
                                sub_sport = col_character(),
                                unknown_110 = col_character()
                                )
               ) %>%
  rename(name = unknown_110,
         jumpingEffect = "Jumping Effect",
         jumps = Jumps
         )
}
passFit <- function() {
getJumpData(getFitOut())
}
#datalist = list()
# Advice from: https://adv-r.hadley.nz/control-flow.html#for-family
# Make sure to preallocate the output container,otherwise the loop will be very slow.
datalist <- vector("list", length(cardio$activity_id))
# Use seq_along(x) instead of 1:length(x). It always returns a value the same length as x.
for (i in seq_along(cardio$activity_id)) {
fitFile <- cardio$activity_id[i]
dat <- passFit()
datalist[[i]] <- dat
}
jumpData <-
bind_rows(datalist) %>%
filter(jumps > 0) %>%
mutate(jpm = jumps / total_elapsed_time * 60)# Determine number of days in a row with a 10 min. jump rope session. Multiple entries per day should be excluded.
sessions <- unique(format(jumpData$start_time, "%A, %B %d, %Y"))library(glue) # for convenient string/var concatenation
pltJumpData <-
jumpData %>%
select(-sub_sport, -name) %>%
pivot_longer(-start_time)
ggplot(pltJumpData, aes(start_time, value)) +
geom_point() +
geom_smooth(method = loess, se = FALSE) +
facet_wrap(~ name, scales = "free_y") +
labs(title = glue("Summary of jump rope session data over {length(sessions)} days"),
subtitle = "Goal is min of 10 min. continuous jumping per session",
x = "Date",
y = "Value") +
theme(axis.text.x = element_text(angle = 45, hjust = 1))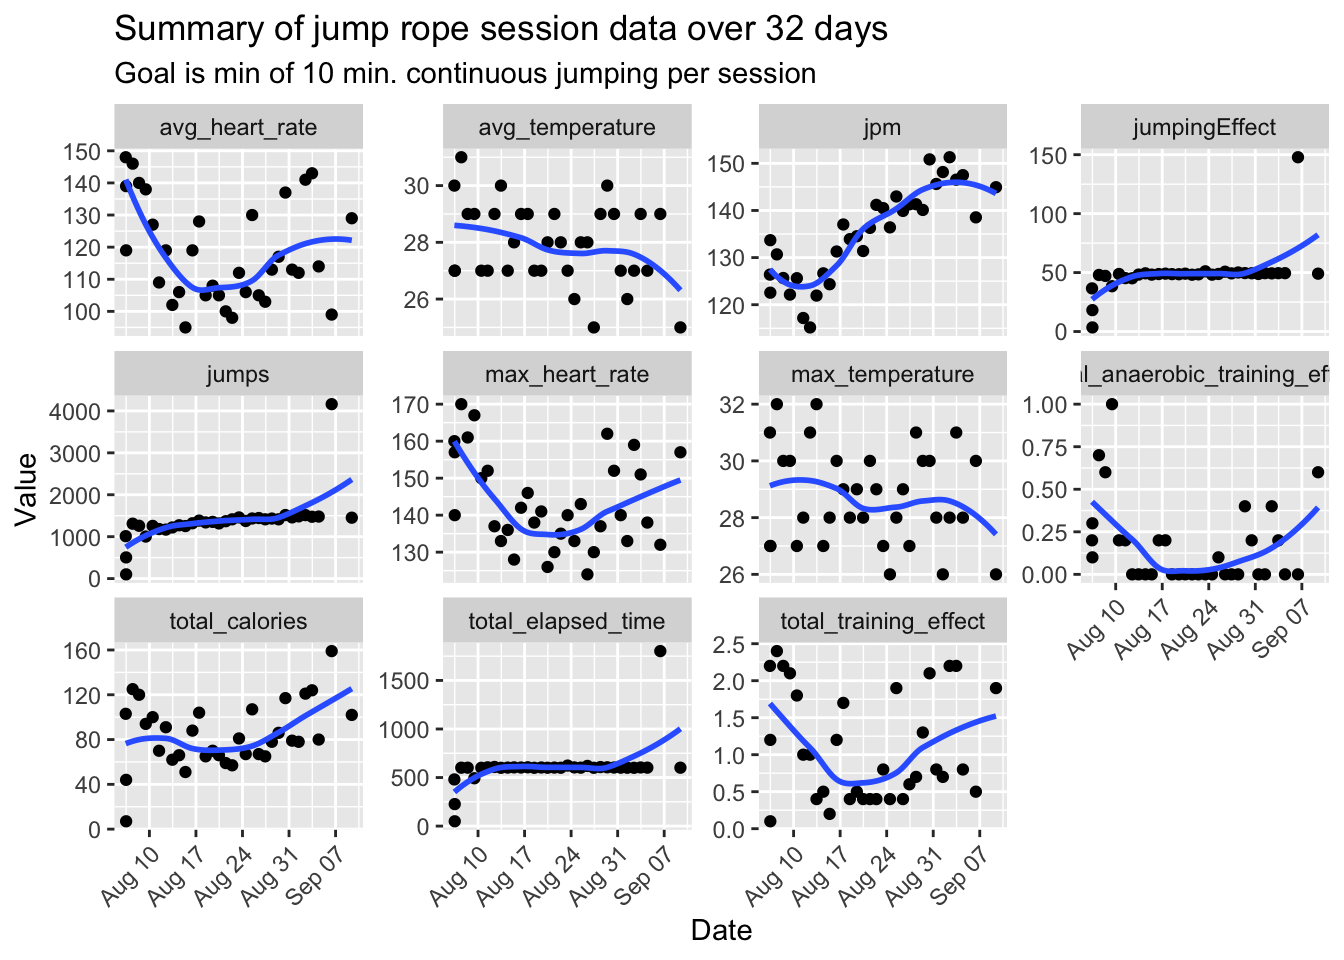
| Days | totalJumps | totalCalories |
|---|---|---|
| 32 | 46554 | 2853 |
The challenge
The natural challenge that I gave myself based on my reading of the above info sources was to jump rope for 30 days straight. And, each session should last for at least ~10 minutes (or at least ~1000 jumps).
Below is the plot that I’ve designed to help me keep track of my daily jump data, while also allowing me to track changes in fitness by observing changes in average heart rate during each jump session over time – a simple metric that will hopefully serve as a useful measure.3
The data also show that as my coordination increases, I am able to jump at a faster rate while keeping my heart rate relatively low. As time goes on and coordination keeps hopefully improving, I will try and jump closer to 160 jpm to try and get my heart rate up for a decent workout.
Additional exploratory data analysis
Total training effect vs. average heart rate
This plot shows that what really matters for a cardio workout is getting your heart rate up and keeping it up. Obviously, this is more achievable the faster you jump, but jump rate is also affected by coordination. This is why there is no clear trend or clustering by jump rate.
As for training effect, the interpretation of this variable is as follows:
| Category | Range |
|---|---|
| No benefit | 0.0-0.9 |
| Minor benefit | 1.0-1.9 |
| Maintaining | 2.0-2.9 |
| Improving | 3.0-3.9 |
| Highly improving | 4.0-4.9 |
| Overreaching | 5.0 |
Also, there is both aerobic and anaerobic training effect. The plot above (and further below) shows only the aerobic training effect since it is really the only significant one. Therefore, for a jump rope session to be a good cardio workout, we should target to have a training effect >= 2.0 – that is, a workout that will allow us to at least maintain our current level of fitness. However, ideally, >= 3.0 would be desirable for cardio gains.
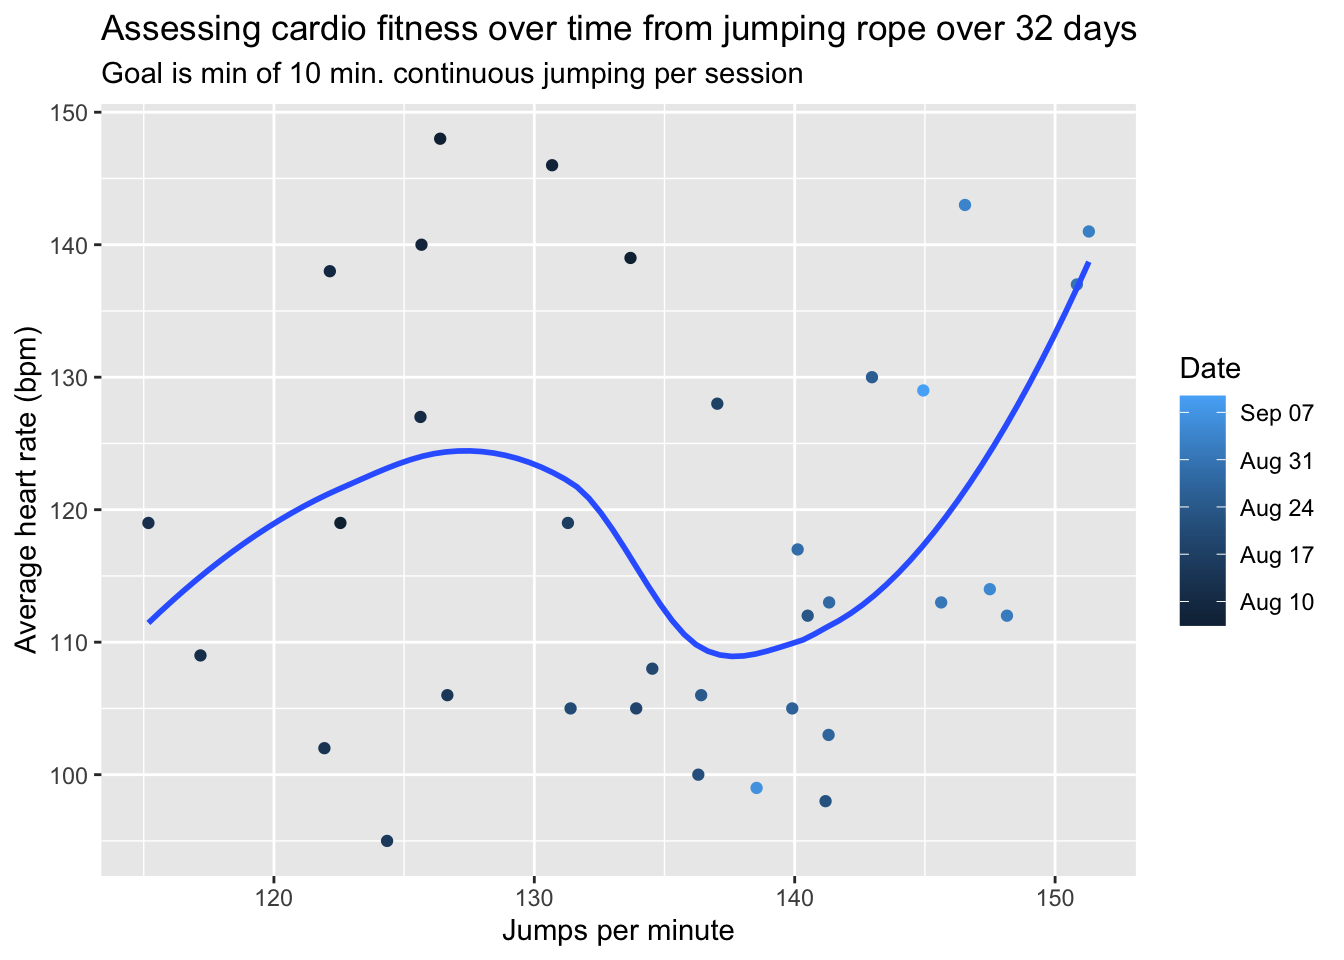
Moving from the top left corner of the plot (higher heart rate and lower jump rate) toward the lower right corner (lower heart rate and higher jump rate) shows an increase in jumping efficiency over time (though not necessarily cardio fitness as discussed above)4.
Average heart rate vs. total jumps by date
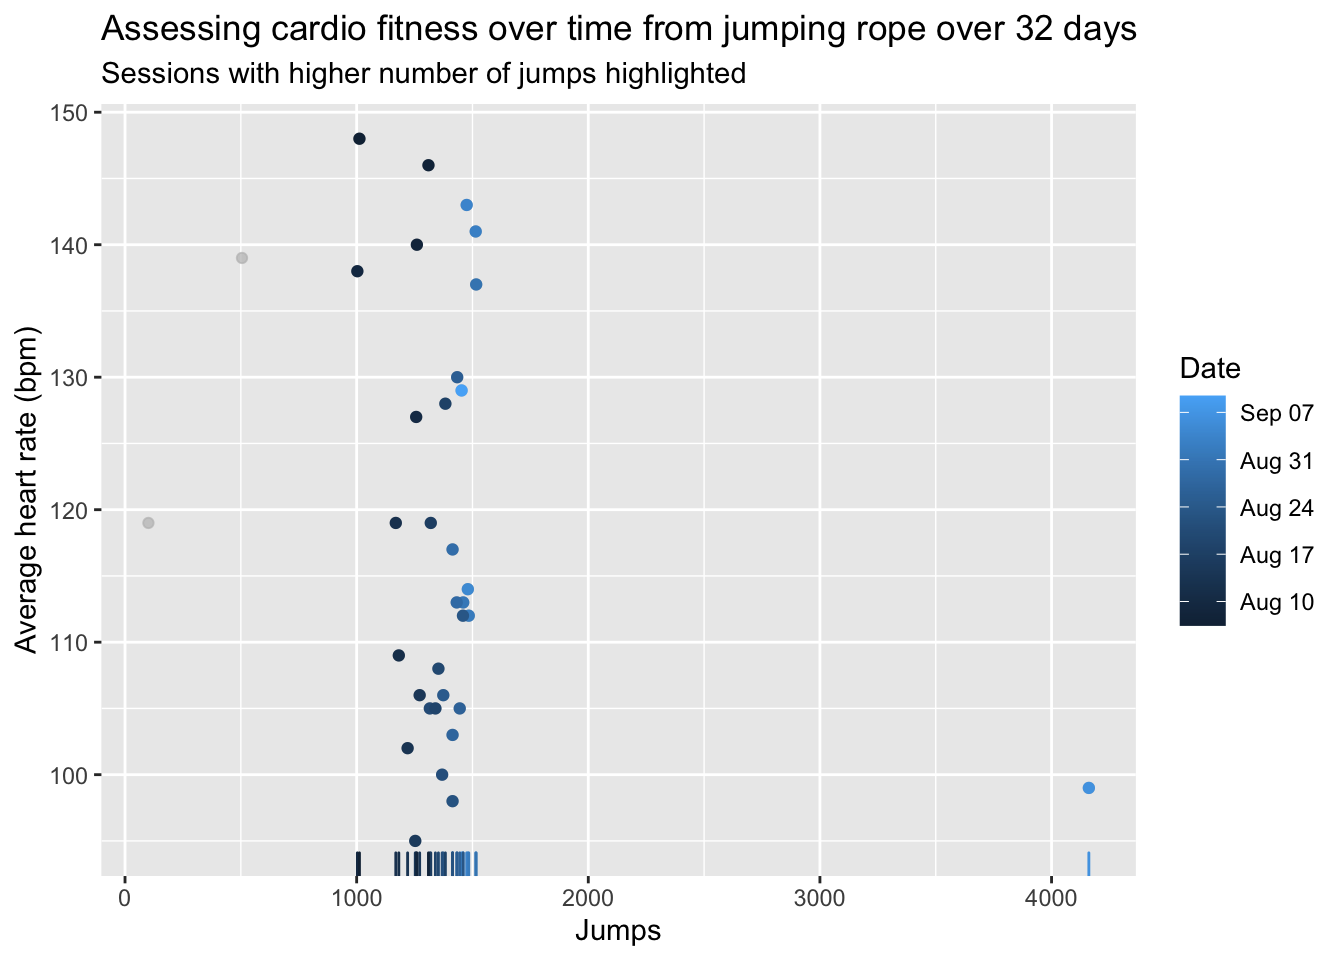
Again, the trend is clear by presenting the data this way with the change in color indicating the change in jumping efficiency.
It also shows that:
- The first couple of days were not very productive and
- Jumping inefficiency decreases very fast!
From the very first plot in this article,5 it seems that there is about a 10 bpm decrease in average heart rate every 2-3 days in the first week! This seems to level out as jumping efficiency increases over time leading to a higher jump rate, which causes a slight bump up in average heart rate.
Data normalization
Recalling that a jumping effect of 100 is equivalent to jumping 20 minutes non-stop at a 120+ jpm pace, we can combine session duration and jump rate variables into a single convenient normalizing parameter. This would allow for removal of arbitrary 10 minute session duration and ~1000 jumps target encouraging growth. This parameter isn’t ideal though as it treats any jump rate above 120 jpm the same. More data is needed at higher jumping effect values (i.e., longer/faster sessions) to say anything about when cardio benefits start to show up.
Using recent hilly training runs to look for cardio gains
Since I’ve been running while doing this jump rope cardio fitness experiment, there is a good opportunity to use the running data as a basis to look for cardio gains.
Looking at recent running data around the Lalitpur foothills near Kirtipur and Tribhuvan University,6 we might be able to detect changes in performance.
Using previous plotting tools developed to analyze and compare series’ of running data, here is a quick plot of some training runs with some variables of interest.
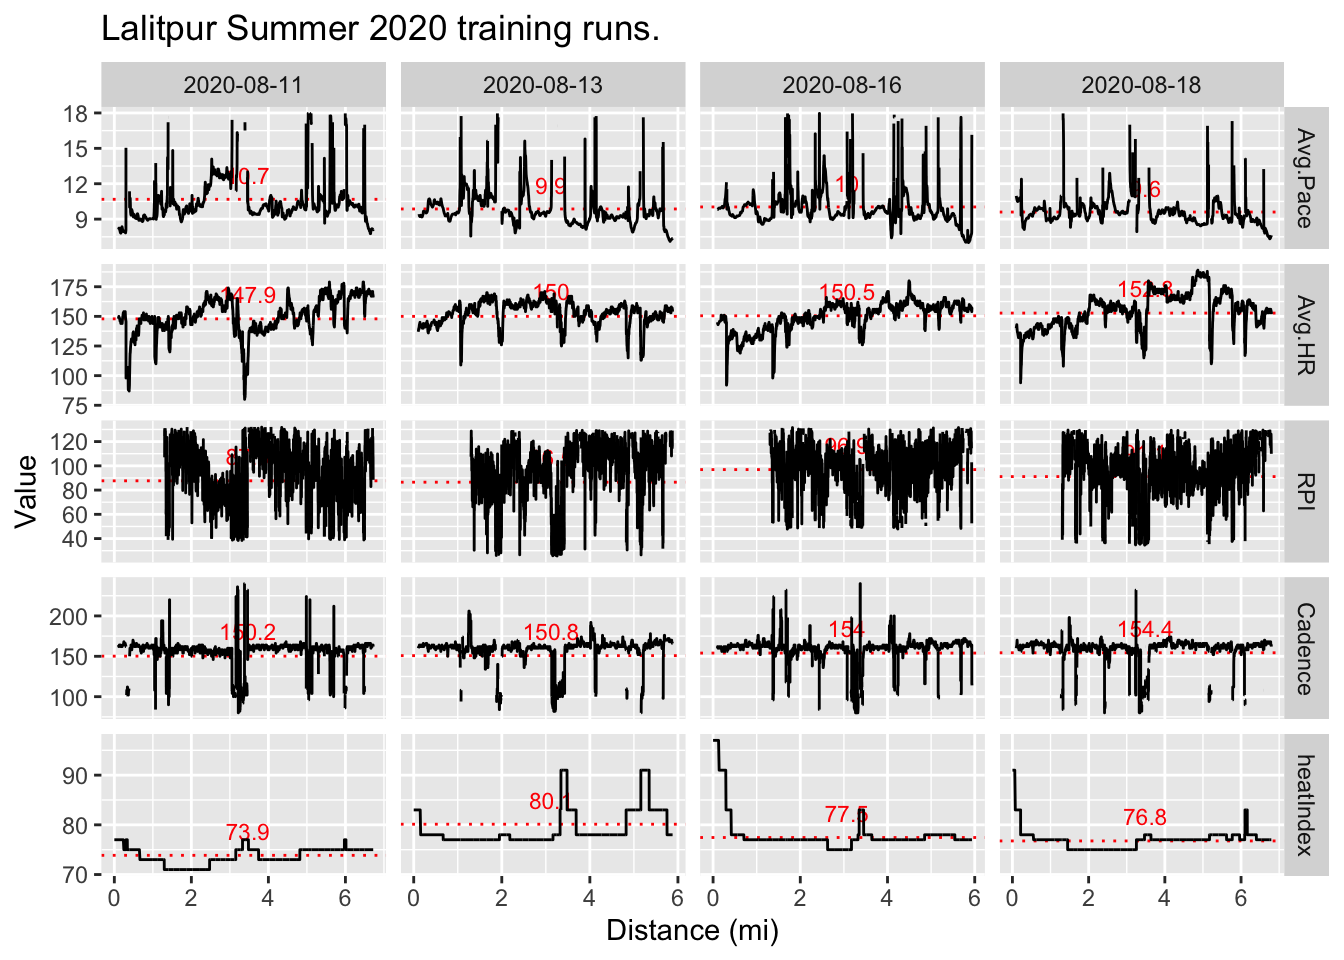
A quick glance indicates a high degree of similarity between these runs although it did rain that first day likely providing a significant cooling effect and slight performance bump.7
Since the running performance index (RPI)8 data is so noisy, it is easier to report in tabular form.
| Date | AvgRPI |
|---|---|
| 2020-08-10 | 112 |
| 2020-08-11 | 100 |
| 2020-08-13 | 90 |
| 2020-08-16 | 110 |
| 2020-08-18 | 96 |
Now back to the question:
Is jumping rope for 10 minutes a day for 30 days straight improving my cardio fitness?
Over the same course of time running, we see that the average RPI (or running economy), which is a function of heart rate and pace, is about the same for each run under similar conditions indicating that my performance isn’t really improving.
Long story short, this matches what my Garmin Connect VO2max data indicates since I started running in Kathmandu this summer with a constant value of 48 ml O2/kg-min.
Here is what the Garmin Connect app says about VO2max:
VO2max is an indication of your cardiovascular fitness and should increase as your level of fitness improves. VO2max is the maximum volume of oxygen (in milliliters) you can consume per minute per kilogram of body weight at your maximum performance. Your compatible Garmin device uses heart rate and exercise data to estimate your VO2max.
And what is really great (from the Forerunner 935 Owner’s Manual):
Your device adjusts the VO2max values for heat and altitude, such as when you are acclimating to high heat environments or high altitude.
So accounting for differences in elevation gives added confidence in the Garmin-calculated VO2max.
tldr
Jumping rope is great for the reasons listed above except it didn’t really improve my cardio fitness [until …].9 Maybe this is because I already had high cardio fitness? Maybe it would be different if I didn’t?
Another thought: As jump rope efficiency increased, I probably should have increased jump rate closer to 160 jpm to provoke a significant cardio response. Maybe then I could have approached a cardio workout equivalent to running a 7 minute mile pace as mentioned earlier.
Notes
2020-08-12
I ran 6.72 miles in morning; average heart rate was 147 bpm.
2020-08-13
While jumping rope today, I naturally started to move my feet differently. I began alternating my feet instead of jumping both at the same time early on in the 10 minute session. This resulted in much less of a bounce height. This also led to much more consistency while jumping with minimal disruptions of jump streaks. I had the realization that the average heart rate data reflected in the plot above is likely more indicative of my body learning to jump more efficiently rather than my cardio fitness improving.
I’m also wondering what the impact of me running relatively long distances recently has on the jump rope data. Does this introduce an element of fatigue or hysteresis that causes my average heart rate data on running days to be biased high when it otherwise wouldn’t be? Needless to say, the first day I went running (yesterday) my calves felt really tight (due to jumping rope every day for a week). However, I noticed that in the morning today, they actually felt better (less tight and sore), as if running helped loosen them up. This is counter to what I would expect though because typically running causes me to have tighter calves. I looked to the internet to try and explain what was going on and found an article mentioning that:
A good way to stretch your calves is during your workout: Walking or running uphill is a great calf activator and naturally forces your muscles to stretch while your heading up.
Since the recent running route is about half uphill, I might be getting some benefit from this.
2020-08-14
I ran 5.88 miles in morning; average heart rate was 149 bpm.
2020-08-18
Need to account for temperature effects.
2020-08-19
Jumped in rain, which served as a cooling effect; temperature conditions similar to yesterday.
2020-08-20
Fever of 100.6-100.9 F measured around 8 pm. Temperature recorded as normal (98.5 F) when woke up next morning around 7 am.
2020-08-23
Twisted ankle playing soccer; no visible swelling, but a significant strain.
100 jpm burns 11.8 METs and 80 jpm burns 8.8 METs.↩︎
Hoping to see a decreasing trend in average heart rate over time indicating an increase in fitness.↩︎
This will be visited momentarily looking at recent running data!↩︎
It’s hard to tell from this plot.↩︎
The runs shown are essentially the same with slight variations due to either time (not enough!) and/or weather (monsoon rains!), which causes a slight (but significant) relative change in total distance.↩︎
This was also the first day running a longer distance and at higher elevation in nearly 7 months. I did run in Bangkok over the past 5 months, but they were much shorter (~3 miles) due to the intense heat.↩︎
See previous post for more about how to interpret this running efficiency metric.↩︎
I guess I could have just looked at the Garmin “training effect” data for the jump rope sessions to see that the “total training effect” values are practically 0! Yet another point of training effect validation…↩︎