Pinning down lap-level running data.
Having to login to the Garmin Connect website and manually download running data in .csv format is starting to get pretty annoying. Searching for a more automated solution, I found a post on Reddit that pointed me to a GitHub repo containing a convenient command-line utility that allows me to download all of my Garmin lap-level activity data directly to binary .fit files. It worked like a charm.
There is also an activity-level SQLite database file available that links the .fit files named based on a unique activity_ID number to a descriptive activity name. In this case, I am trying to isolate all runs named “Vadhana Running” for this particular analysis, so the database is useful to screen activity IDs.
The next problem was that the .fit data needed to be converted to .csv format. Luckily, I managed to find a blogger describing a utility they built to do just this, which sent me to another GitHub repo containing a Python script that gets the job done.
After running the Python script on the running activities of interest on my computer locally outside of R, I was ready to import the data for plotting building on my previous post.
Calculating heat index.
In my next post, I want to take a look at heat limited running pace. For that analysis, I would like to experiment with using heat index data to develop a simple model relating heat index and heat limited running pace. And, for heat index data, I will need relative humidity data. Unfortunately, this is not included in the .fit files or other downloadable data files that I could find. But, this data is embedded in the map object on the Garmin Connect website. So I am able to manually add it in.
Heat index is calculated using a function from the weathermetrics library that calculates the heat index based on the NOAA algorithm.
library(weathermetrics)

humidity  <-
  tribble(
    ~Date,  ~humidity,
    "2020-03-24", 54,
    "2020-03-25", 61,
    "2020-03-27", 57,
    "2020-03-30", 57,
    "2020-04-07", 68,
    "2020-04-10", 54,
    "2020-04-14", 68,
    "2020-04-16", 67,
    "2020-04-19", 57,
    "2020-04-21", 51,
    "2020-04-24", 57,
    "2020-04-27", 70,
    "2020-04-30", 71,
    "2020-05-05", 70,
    "2020-05-07", 55,
    "2020-05-10", 58,
    "2020-05-15", 54,
    "2020-05-20", 56,
    "2020-05-24", 65,
    "2020-05-26", 67
)

humidity$Date <- as.Date(humidity$Date)
And now lap data can be easily plotted by:
- Running
download_create_dbs.sh1 to generate a local database of all Garmin activity data and bypassing manual login to the Garmin Connect website. - Simply converting any number of
.fitfiles of interest to.csvformat usingconvert_fit_to_csv.py. - Performing a little automated post-processing in R to setup a dataframe with variables of interest.
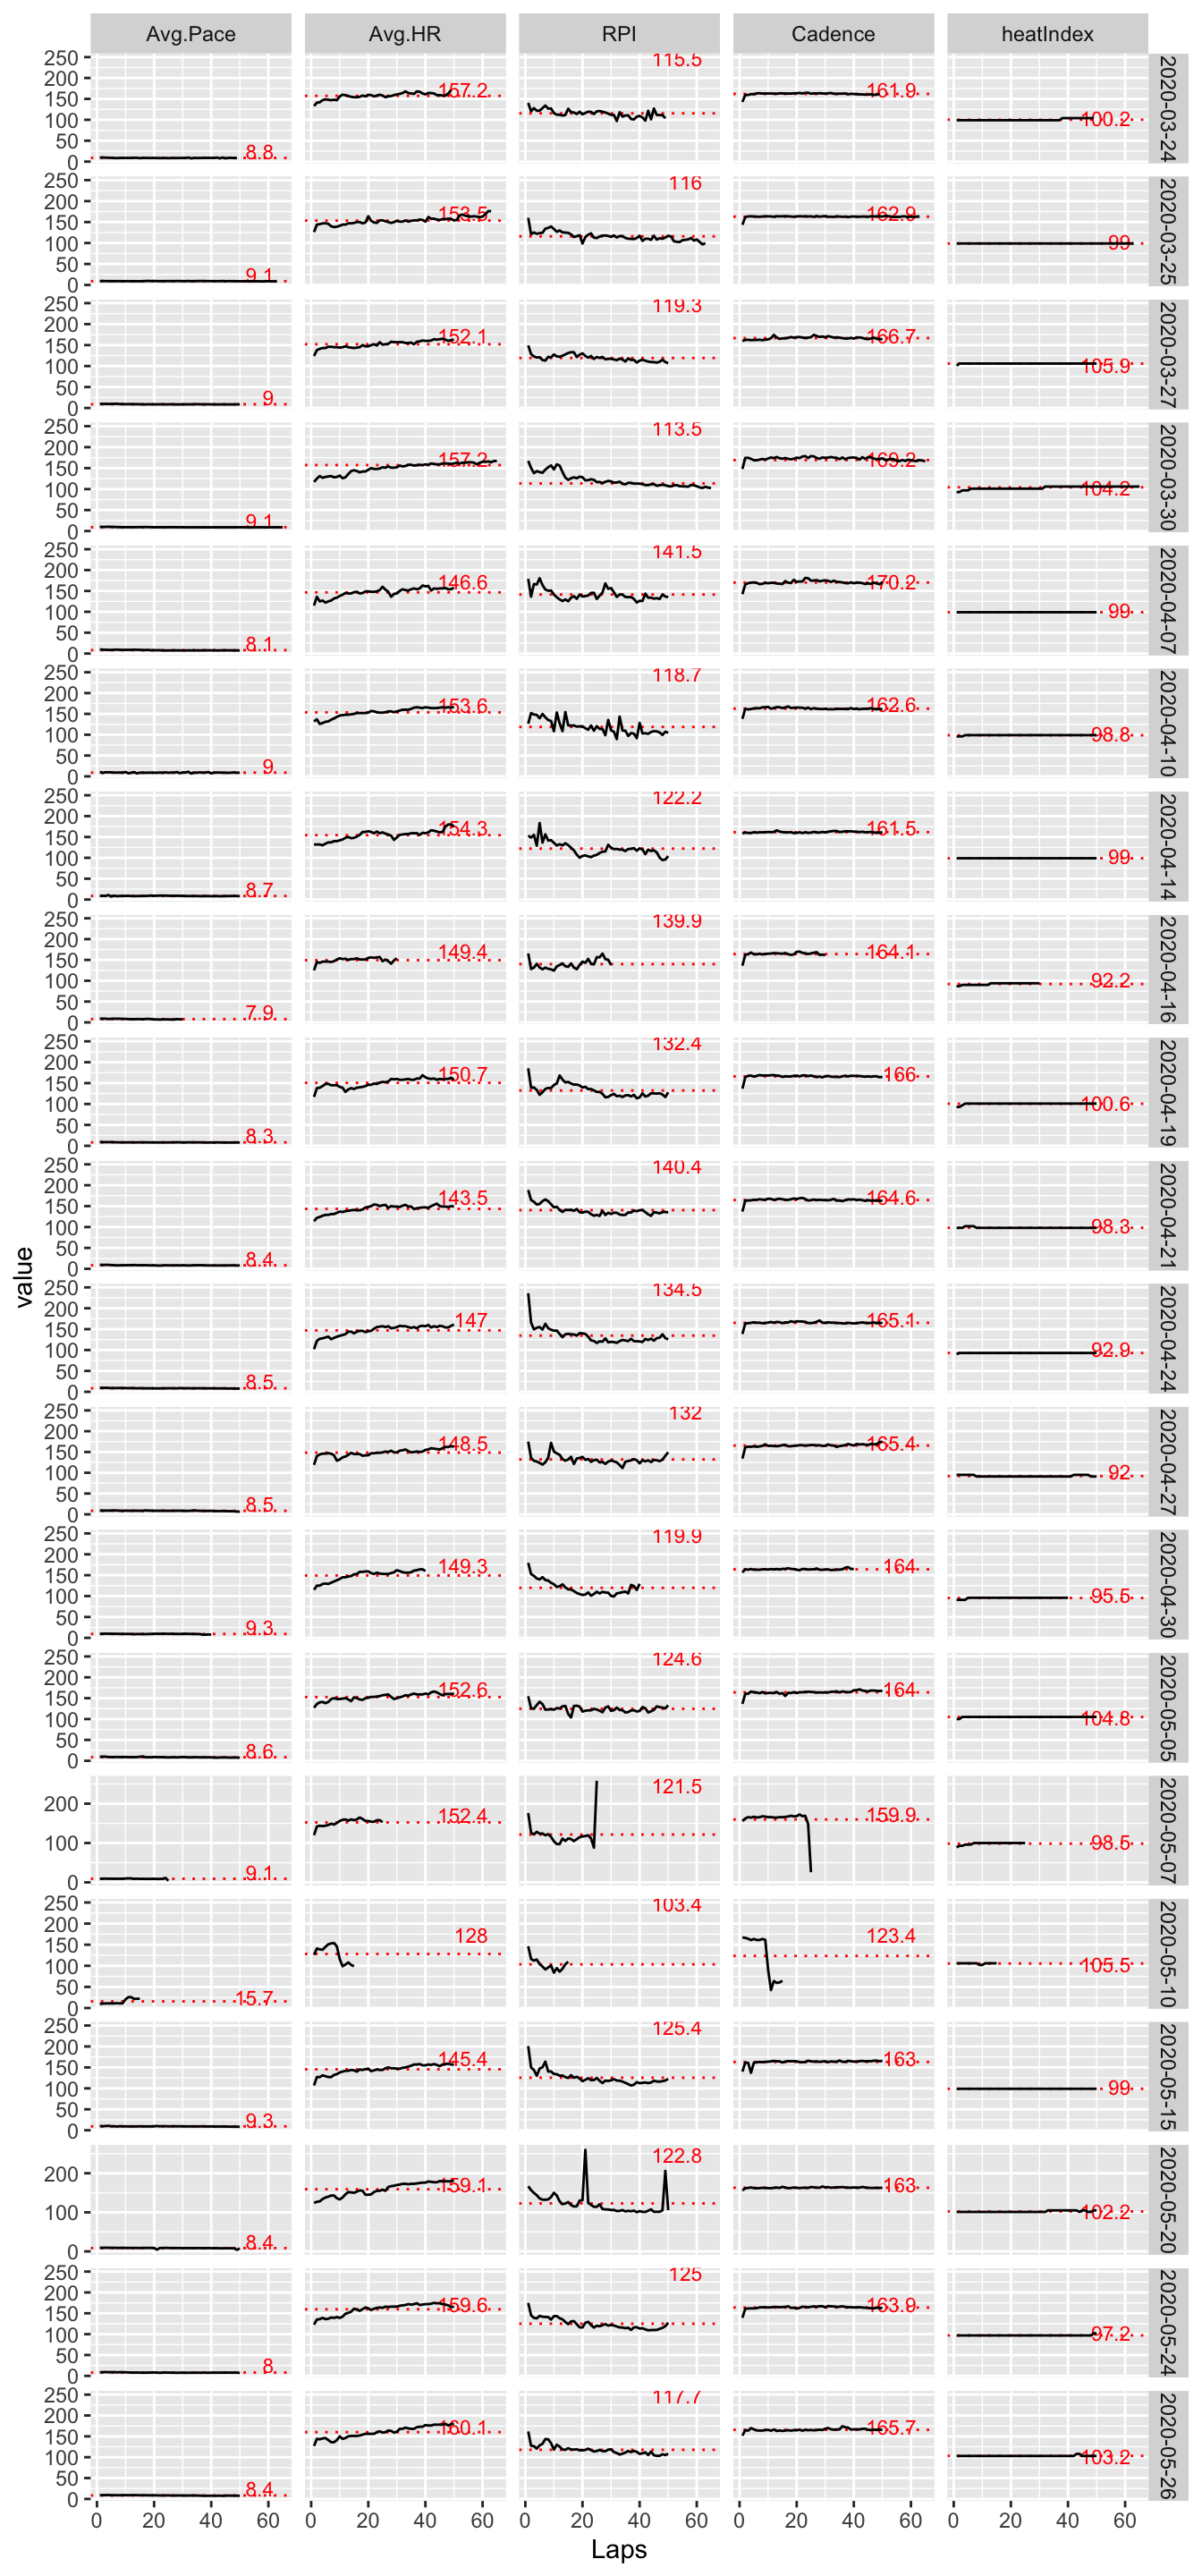
Plotting the lap data from all of the Vadhana runs is now simple by re-using the plotting code from a recent related post.
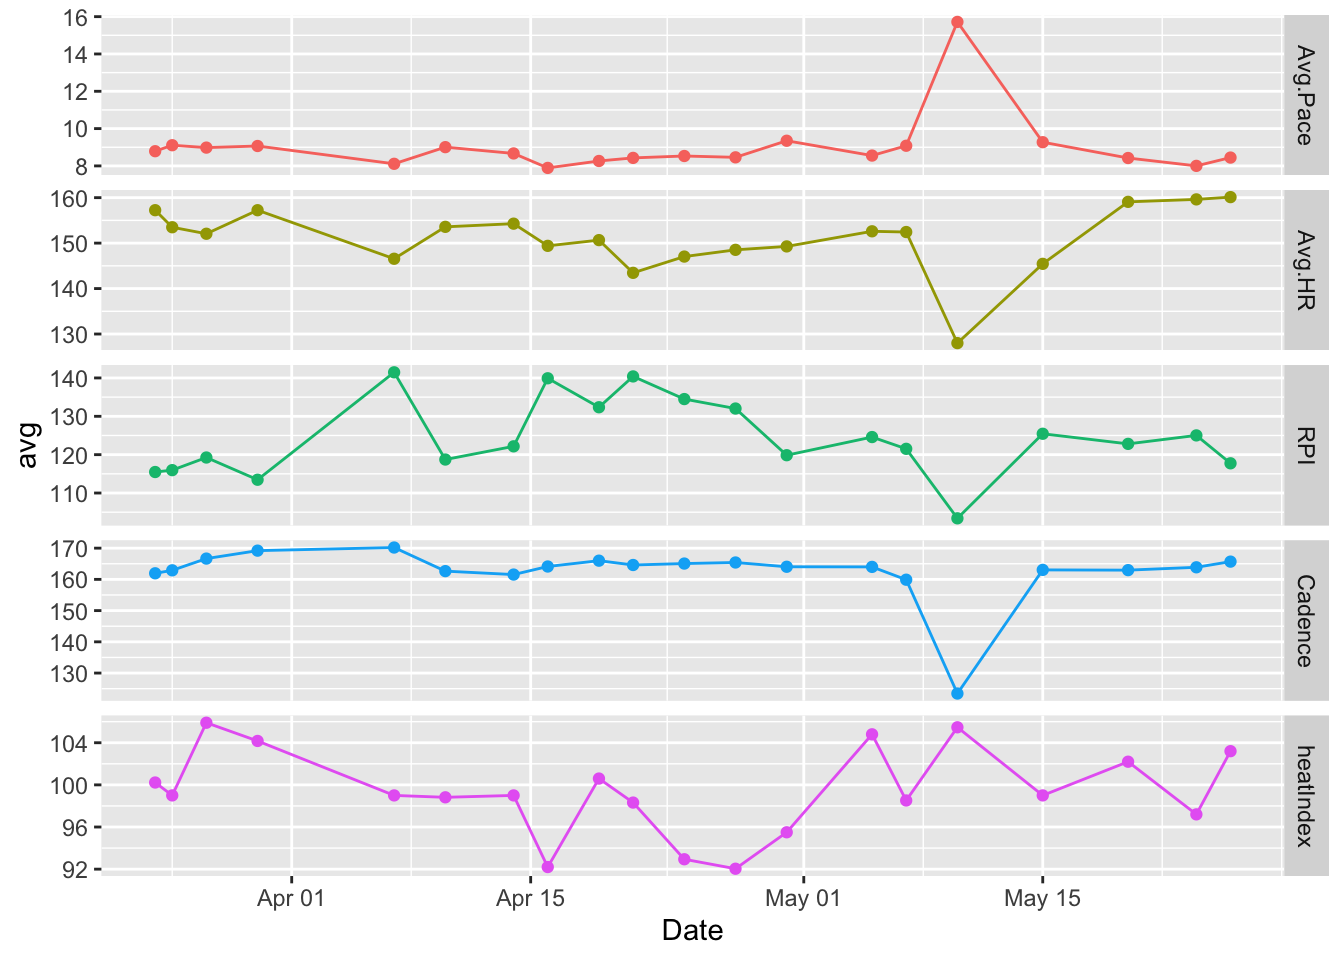
And finally, a summary plot of all my Bangkok late Spring 2020 runs at the Vadhana fixed track I used as my training ground.
Or
download_update_dbs.shif the database has already been created.↩